Author:
Joan Hall
Date Of Creation:
28 July 2021
Update Date:
10 May 2024

Content
The interquartile range is used in statistical analysis to help draw conclusions about a dataset. Its use is often preferable to using the range when determining the scatter of the data, since it does not account for most outliers.
Steps
 1 Determination of the interquartile range. Interquartile range - the difference between the first and third quartiles: Q3 - Q1
 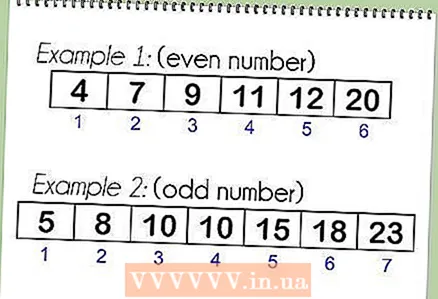 2 Order your data in ascending order.
- Example1 (even number of data): 4 7 9 11 12 20
- Example2 (odd number of data): 5 8 10 10 15 18 23
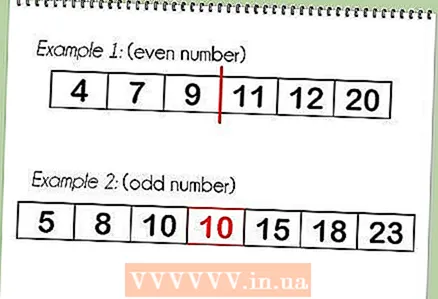 3 Find the middle of the dataset to split it in half.
- Example1 (even): 4 7 9 | 11 12 20
- Example2 (odd): 5 8 10 (10) 15 18 23
 4 Find the median of the bottom and top half of the dataset, excluding the value in the middle (if you have an odd number of data).
- Example for a set with an even number of data:
- Lower half median = 7 (Q1)
- Upper Half Median = 12 (Q3)
- Example for a set with an odd number of data:
- Lower half median = 8 (Q1)
- Upper Half Median = 18 (Q3)
- Example for a set with an even number of data:
 5 Subtract Q3 - Q1 and find the interquartile range.
- Example1 (even): 12 - 7 = 5
- Example2 (odd): 18 - 8 = 10


